Weekly Muni Commentary
August 18th | Q3 2025
Daily Avg. Offering Line Items
Daily Avg. Notional Offered
CUSIPs Offered on TWD
Dealers Offering on TWD
Buy/Sell Ratio Trend
Bid Wanted Flow
Have a great week!

Interested in trading with us?
“The information included herein is intended for general informational purposes only. Tradeweb does not guarantee the accuracy of the information contained herein and makes no representations or warranties and disclaims all express, implied and statutory warranties of any kind. All information is provided “as-is” and Tradeweb is not liable for any damages arising out of the use or access to the information, including any consequential, incidental or indirect damages relating to the information contained herein. None of the information in the report constitutes an offer or solicitation to buy or sell any security or financial product, a recommendation concerning any security, financial product or asset class, or an offer to provide investment advice or any other service.”
Retail to the Rescue: How Retirees and Their Wealth Managers Have Breathed New Life into Institutional Muni Markets


Retail Trading Desks Find the Network Effect in Muniland

The Bright Side of Muni Market Volatility: Tax-loss Harvesting
Happy Monday!
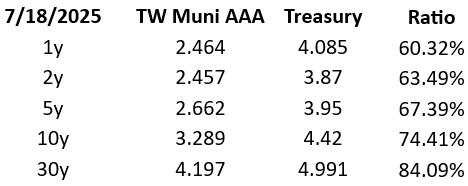
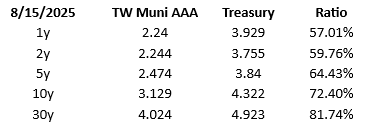
Municipals held steady week-over-week in the front and intermediate ranges of the curve, while the long end experienced slight cuts following a stronger-than-expected Producer Price Index release on Thursday. The July PPI rose 0.9%, the sharpest monthly increase since March 2022 and well above the estimate of 0.2%. On an annual basis, prices rose 3.3% compared to the 2.5% estimate. While a September rate cut remains the market consensus for now, a fresh slate of August inflation and employment data will be released prior to the next FOMC meeting. As of Friday’s close, CME Fed Fund Futures indicate an 84.6% probability of a 25bp rate cut at the September FOMC meeting—down slightly from 88.9% one week earlier. Municipal market technicals remain favorable, largely driven by record issuance, reinvestment/fund flows, neutral-to-positive credit quality outlooks, and a steepening yield curve.
Mutual funds saw a $107mm outflow for the week ending Wednesday, compared to a $1.6B inflow the week prior, according to LSEG Lipper. This marks only the third weekly outflow in the past 17 weeks, with previous instances occurring during the weeks ending July 16 and April 23. On Tradeweb Direct, daily average muni trades and volume rose week-over-week for institutional and dealer clients, led by a 13% weekly increase from institutional clients. Buy/sell ratios for the week closed at 2.7 for retail (from 2.5), 1.1 for institutional (from 1.3) and 0.5 for dealers (from 0.6).
The new-issue calendar for the week ahead is estimated at $6.16B, with $5.06B of negotiated deals and $1.1B of competitive deals, according to LSEG. Notable deals include: NYC TFA ($1.38B), Los Angeles County Public Works Financing Authority ($826mm), Louisiana Gasoline and Fuels Tax ($390mm), Austin TX ISD ($243mm, PSF), Clovis CA Unified School District ($134m), Louisville/Jefferson County Metro Government Board of Water Works ($231mm, COMP), Minneapolis, MN GO ($140mm, COMP), Madison, WI GO ($130mm, COMP).


SUBSCRIBE FOR WEEKLY UPDATES
Already trading with us? Click here.
Proportion of muni buys vs. sells by client type on the TWD platform.
For the avoidance of doubt, a ratio < 1 indicates net selling activity.
Relative number of bid wanted requests sent to the TWD platform by client type, indexed to the first month in the time series.
Number of municipal inventory line items available on the TWD platform daily by liquidity provider type.
Municipal notional (000s) offered on the TWD platform daily by liquidity provider type.
Number of unique municipal CUSIPs offered daily on the TWD platform daily.
Number of unique liquidity providers offering municipals daily.
Hover to learn more
04-03-23
04-10-23
04-17-23
04-24-23
05-01-23
05-08-23
05-15-23
05-15-23
05-15-23
05-22-23
05-29-23
06-05-23
06-12-23
06-19-23
04-03-23
04-10-23
04-17-23
04-24-23
05-01-23
05-08-23
05-15-23
05-15-23
05-15-23
05-22-23
05-29-23
06-05-23
06-12-23
06-19-23
04-03-23
04-10-23
04-17-23
04-24-23
05-01-23
05-08-23
05-15-23
05-15-23
05-15-23
05-22-23
05-29-23
06-05-23
06-12-23
06-19-23
04-03-23
04-10-23
04-17-23
04-24-23
05-01-23
05-08-23
05-15-23
05-15-23
05-15-23
05-22-23
05-29-23
06-05-23
06-12-23
06-19-23
04-03-23
04-10-23
04-17-23
04-24-23
05-01-23
05-08-23
05-15-23
05-15-23
05-15-23
05-22-23
05-29-23
06-05-23
06-12-23
06-19-23
04-03-23
04-10-23
04-17-23
04-24-23
05-01-23
05-08-23
05-15-23
05-15-23
05-15-23
05-22-23
05-29-23
06-05-23
06-12-23
06-19-23
The information included herein is intended for general informational purposes only. Tradeweb does not guarantee the accuracy of the information contained herein and makes no representations or warranties and disclaims all express, implied and statutory warranties of any kind. All information is provided “as-is” and Tradeweb is not liable for any damages arising out of the use or access to the information, including any consequential, incidental or indirect damages relating to the information contained herein. None of the information in the report constitutes an offer or solicitation to buy or sell any security or financial product, a recommendation concerning any security, financial product or asset class, or an offer to provide investment advice or any other service.